
The multifamily real estate market in the United States has witnessed significant changes in recent years, driven by economic fluctuations, evolving tenant preferences, and the impact of global events such as the COVID-19 pandemic. Commercial real estate (CRE) asset managers, investors, and owners rely on data to make informed decisions in this dynamic industry.
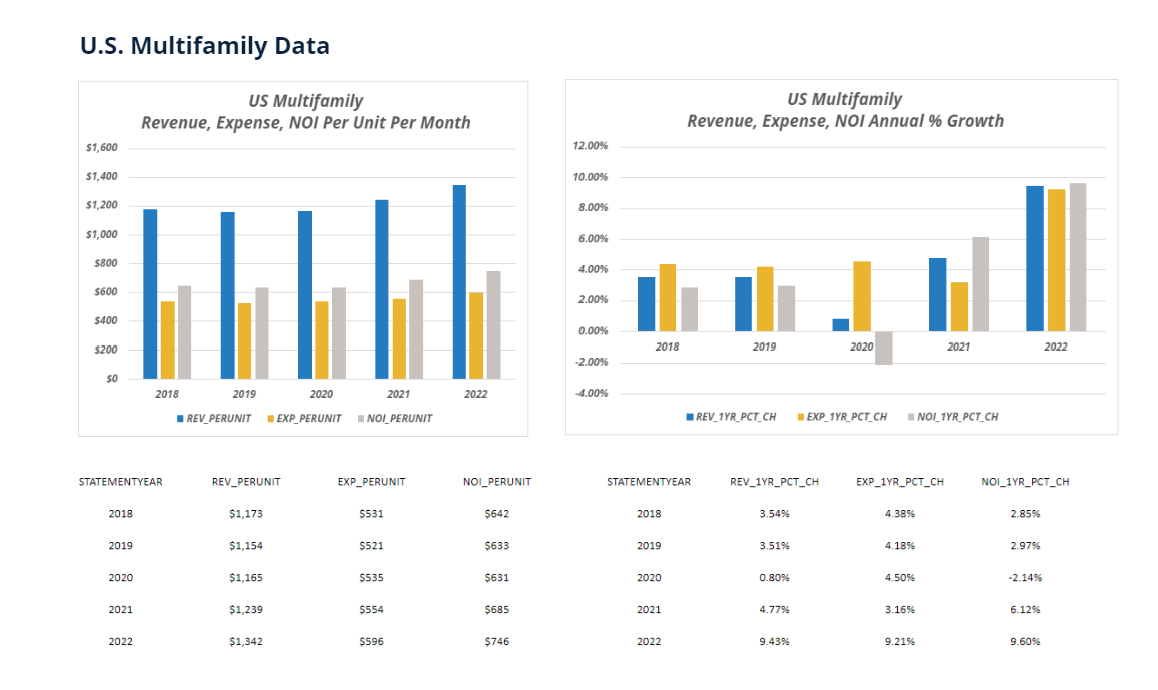
In 2022, the money earned from apartment buildings, the money spent on them, and the overall profit all went up a lot, around 9.26%, 9.20%, and 9.30%, respectively. This increase is similar to the rise in the cost of living, which is now the highest it’s been since the early 1980s. In the last five years, the average increase in money earned, money spent, and profit was lower, about 4.38%, 5.09%, and 3.82%, respectively. Since spending more money increased faster than earning more money in recent years, and because prices are still going up more than the government wants, it’s a good idea for investors to carefully check where the spending is going in the apartment business and look at the differences between different types of apartments and places.
In this blog, we will analyze U.S. multifamily data to understand the trends in revenue, expenses, and net operating income (NOI) per unit per month from 2018 to 2022. Using the charts below, we will break down each trend by year.
Revenue Trends
Revenue is a crucial metric for multifamily property owners, as it directly affects profitability. Below is a breakdown of revenue trends over the past five years:
2018:
In 2018, the U.S. multifamily market experienced steady revenue growth, with the average revenue per unit per month increasing by approximately 2.5% compared to 2017. The strong economy and high demand for rental properties contributed to higher rent prices and increased occupancy rates, boosting revenue for property owners.
2019:
2019 continued the upward revenue trajectory, with a similar 2-3% annual increase. Strong job markets and wage growth continued to drive demand for rental housing, enabling property owners to charge higher rents.
2020:
The COVID-19 pandemic had a significant impact on the multifamily market in 2020. With job losses and economic uncertainty, many tenants faced financial hardships, leading to a decrease in rental revenue. Owners and property managers responded with concessions, rent freezes, and other measures to retain tenants, resulting in a slight dip in average revenue per unit.
2021:
As the economy started recovering in 2021, rental revenue rebounded, and some markets experienced a surge in demand. Property owners adjusted their rental strategies, introducing innovative amenities and flexible lease terms to cater to changing tenant preferences.
2022:
In 2022, revenue growth remained strong, with an average increase of around 4% compared to the previous year. The multifamily market adapted to the post-pandemic environment, with a focus on technology and sustainability, which allowed property owners to command higher rents.
Expense Trends
Understanding expenses is crucial for property owners to manage their cash flow effectively. Below is a look at the trends in multifamily property expenses:
2018-2019:
Operating expenses for multifamily properties remained relatively stable during these years.
Maintenance, property management, and utilities continued to be the primary components of expenses.
2020:
The pandemic disrupted expense patterns, with increased spending on cleaning and sanitation, PPE for staff, and reduced maintenance due to lockdowns. Property owners faced challenges in balancing expenses while accommodating tenant needs.
2021:
In 2021, as the economy improved, some expenses related to COVID-19 precautions decreased, but labor and supply chain challenges led to increased maintenance costs. Rising construction and material costs also impacted capital expenditures for property renovations.
2022:
By 2022, expenses had stabilized, with property owners optimizing operations and embracing technology to streamline management and reduce costs. Some expenses remained elevated, particularly in markets where labor shortages persisted.
Net Operating Income (NOI) Trends
NOI is a key metric that reflects a property’s profitability. It is calculated by subtracting operating expenses from revenue. Below is how NOI per unit per month evolved from 2018 to 2022:
2018-2019:
NOI steadily increased, reflecting the growth in rental revenue.
2020:
NOI experienced a dip due to decreased revenue and increased expenses during the pandemic.
2021-2022:
As the multifamily market rebounded and expenses stabilized, NOI recovered and surpassed pre-pandemic levels.
Analyzing U.S. multifamily data from 2018 to 2022 reveals a resilient industry that adapted to the challenges posed by the COVID-19 pandemic. While revenue experienced fluctuations, property owners who effectively managed expenses and embraced innovation were able to maintain or even improve their NOI. However, 2023 has presented new challenges that we must learn to navigate including high interest rates, rising cap rates, and decreased transaction volume.
Investors and industry professionals must continue to monitor these trends closely to make informed decisions in this ever-changing multifamily market. Adapting to tenant preferences, implementing cost-effective technologies, and staying responsive to economic shifts will be key to success in the years ahead.
About the Multifamily Operating Performance Chartbook
The Chartbook includes bar chart data for calendar years 2018-2022 providing the following data for different segments of the Multifamily Market broken down by Subtype and CMSA:
- Top-Line Revenue, Expense, and NOI (expressed as $ per unit per month and Annual % Growth)
- Taxes, Insurance, Utilities, Management Fees, Repairs, and Payroll Operating Statement Line-Items (expressed as a % of total Expenses and Annual % Growth).