CRE Utilities: Understanding Market Dynamics and Data to Navigate Rising Costs
Every commercial real estate (CRE) property requires that you pay regular maintenance, utilities, facility management, and property taxes. The overall operating costs for a building varies depending on the size of the space, location, and building function. In general, the total operating expenses in a commercial office space, for example, equal about $17.68 per square foot.
More specifically, utilities like water and electricity contribute significantly to these operating costs. Over the last 5 years, these costs have risen from around 4% to almost 10%, contributing to the ongoing conversation around rising CRE expenses and how to mitigate costs.
Thirty Capital Performance Group’s 2023 State of Multifamily Operations Chartbook can help you make sense of multifamily utility data and apply it to projections across your own portfolio.
Download the 2023 State of Multifamily Operating Performance Chartbook to access your CMSA!
Reviewing the 2023 State of Multifamily Operating Performance Chartbook Data for CRE Utilities
Charts 1 and 2 below show the Utilities Operating Statement line-item as a % of total Expenses and Annual % Growth for both Utilities and Total Expenses aggregated across the full US Multifamily Market.
One can see from Chart 1 that the contribution of the Utility line-item to Total Expenses has been stable at approximately 16% over the last 5 years. Utility expenses can be influenced by many factors including utility rate fluctuations, seasonal demand changes, building energy efficiency, household size, and lifestyle type. Energy-related utilities, such as electricity and gas, exhibit seasonal fluctuations and are more susceptible to short-term supply and demand imbalances in both local and global energy markets. By comparing Chart 2 (US Multifamily Annual % Growth) and Chart 3 (Piped Gas Price in US City Average) below, one can see that annual Utility costs have fluctuated over the past 5 years in a pattern that is consistent in direction (but not in magnitude) with the average price of piped gas in US Cities, as reported by the Federal Reserve and Bureau of Labor Statistics.
Chart 1: Utilities of Total Expenses Chart 2: Utilities Annual % Growth
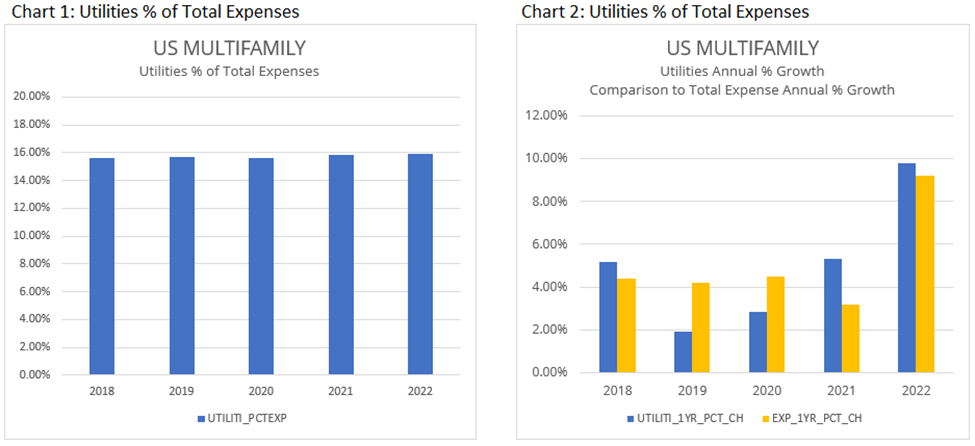
Chart 3: Piped Gas Price in US City Average
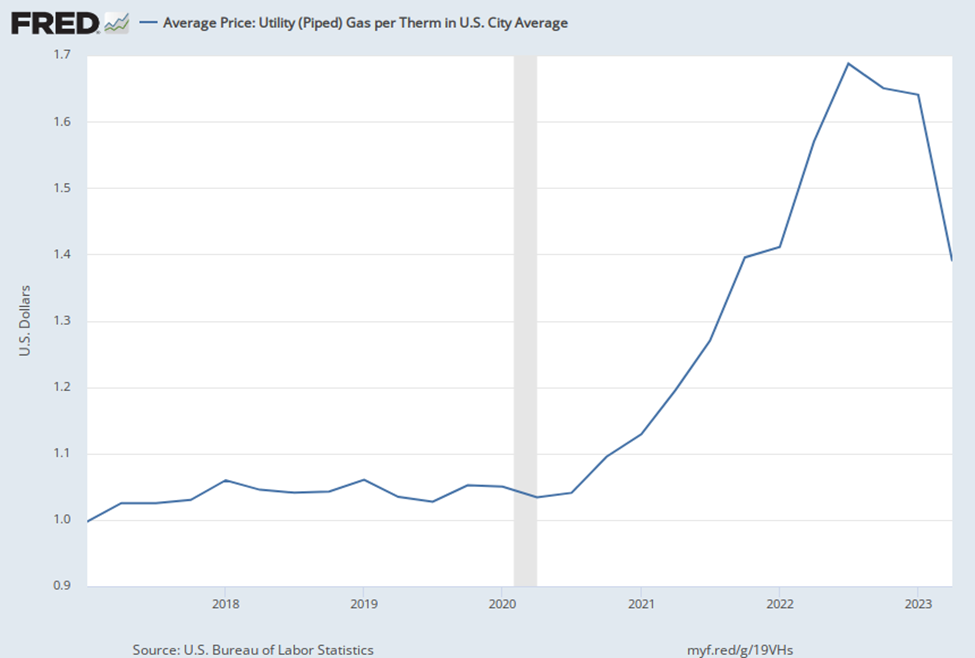
Consistent with our Utilities Expense Growth chart, the Fed’s Gas Price chart shows an increase in 2018, stability in 2019 and 2020, followed by a very sharp increase that begins in 2021. Prices now appear to be declining in 2023. Based on this comparison we would expect that growth in the Utilities line-item from 2022 to 2023 will cool and perhaps report negative growth in 2023.
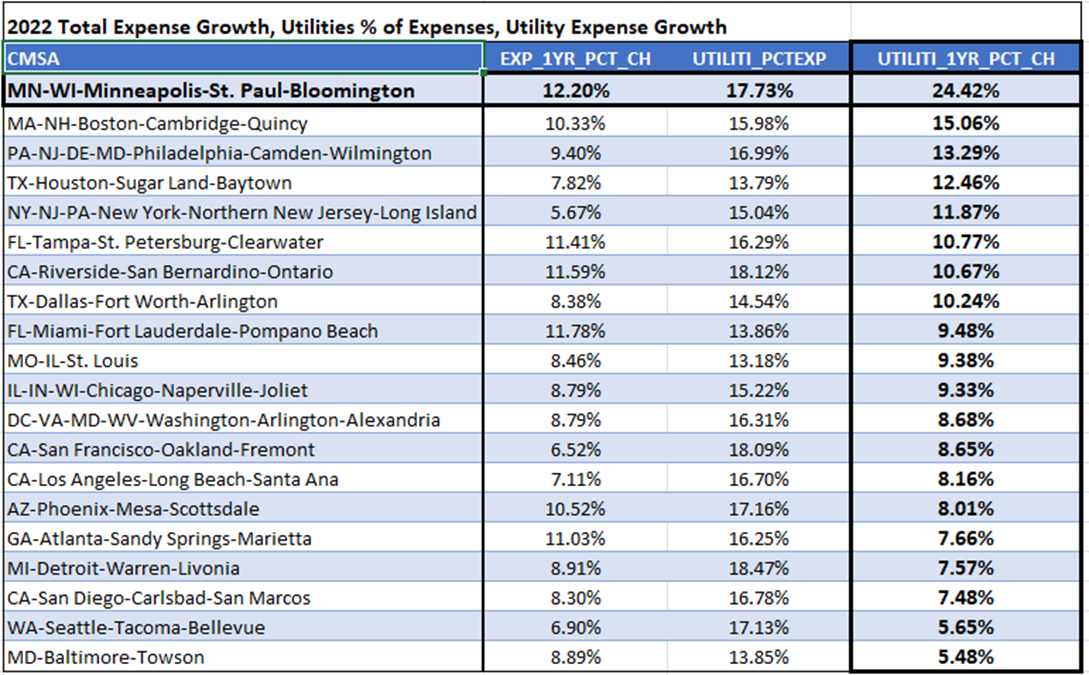
In Chart 4 below we review 2022 Annual Growth for Utilities and Total Expense Growth across the top 20 CMSAs. The table shows the wide disparity across markets with the MN-WI-Minneapolis-St. Paul-Bloomington CMSA topping the list with a whopping increase of 24.42% increase in the Utilities line-item in comparison to a US average of approximately 10% growth (see Chart 2).
Chart 4: CMSA’s ranked by Growth in the Utilities Line-Item
Source: Thirty Capital Performance Group
With the Utilities expense category representing almost 18% of the Minneapolis expense load, the 24.42% annual growth was a significant contributor to Minneapolis having highest Expense Growth across the 20 CMSAs. The Minneapolis Expense Growth was 12.20% in comparison to the approximately 9.5% for the US Average (see Chart 2).
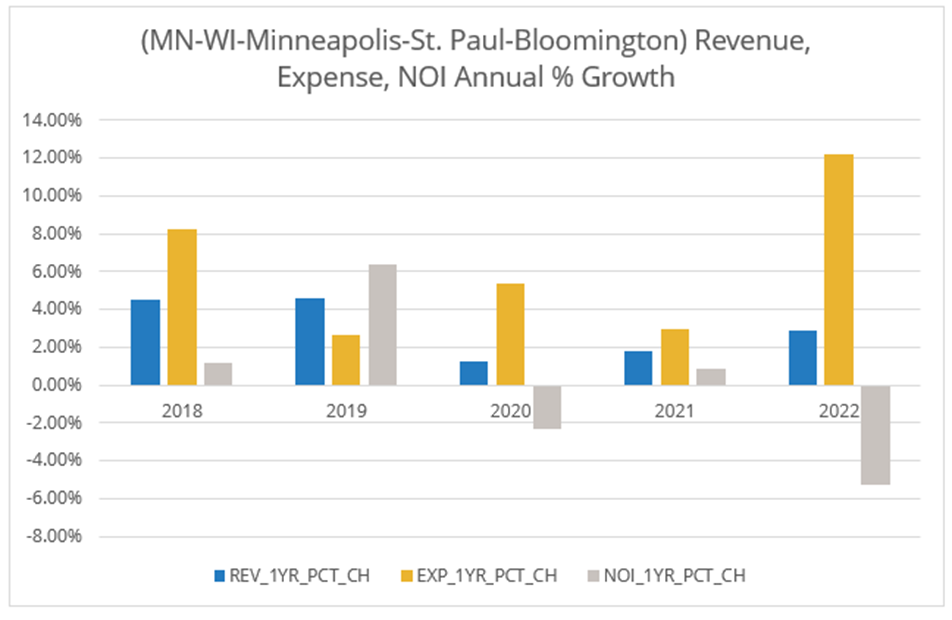
Continuing with the Minneapolis CMSA as an example, Charts 5 below shows Revenue, Expense, and NOI Growth for 2018-2022. One sees that the high overall Expense Growth combined with sub-par Revenue Growth combined to generate negative NOI Growth (approximately -5%). This compares to approximately 9.5% NOI Growth for the US Average.
Chart 5: Minneapolis CMSA Revenue, Expense, NOI Growth.
Source: Thirty Capital Performance Group
Minneapolis has some of the coldest temperatures in the US, and natural gas accounts for a disproportionately large percent of total Utility costs in the CMSA. While this example is specific to Minneapolis, it provides an important illustration of distinctive factors that can affect performance in different locales and the importance of studying the data and understanding impacts across all the various expense line-items.
Using Chartbook Data from Larger CMSAs to Apply to Smaller Markets
While a lot of conversations focus on scenarios in states like Texas and Florida, this data is also relevant across markets. As development trends slow down in areas experiencing rising expenses, developers and underwriters are recalibrating their strategies by examining demographic shifts. For instance, as people leave high-cost cities like New York and relocate to more affordable areas like Philadelphia, the commercial real estate market adapts to accommodate these changing preferences and costs of living. In this dynamic landscape, leveraging data, like the 20 CMSAs found in the 2023 State of Multifamily Operating Performance Chartbook, and innovation, such as water use monitoring or automated HVAC systems, are important for navigating rising costs.
About Thirty Capital Performance Group
Thirty Capital Performance Group is a real estate advisory company providing expertise at the intersection of capital markets, technology, data analytics, and data science to deliver results to clients. The multidisciplinary team solves the challenges faced by owners, operators, property managers, asset managers, and institutional investors in validating cashflow and economic assumptions, providing independent, unbiased insights and recommendations.
Contact us today to speak with an expert!