CRE Financial Modeling and Forecasting: Understand and Optimize Your Portfolio’s Performance

Commercial real estate (CRE) financial modeling and forecasting can be viewed somewhat as “predictive analysis” for how your portfolio is expected to perform in relation to your firm’s goals and to the broader market. Additionally, today’s activist investors want a constant pulse on how their investment is performing; with an accurate forecast, the information they need is readily available.

In light of ongoing economic changes and shifts in the CRE market, your modeling and forecasting scenarios and strategies more than likely look completely different than anything you’ve had in the past. Read ahead to learn about the different types of CRE modeling and forecasting techniques and how to apply them to optimize portfolio performance.

CRE Financial Modeling and Forecasting Strategies

There are several modeling and forecasting strategies that can be applied to a CRE portfolio, including:

Market Analysis

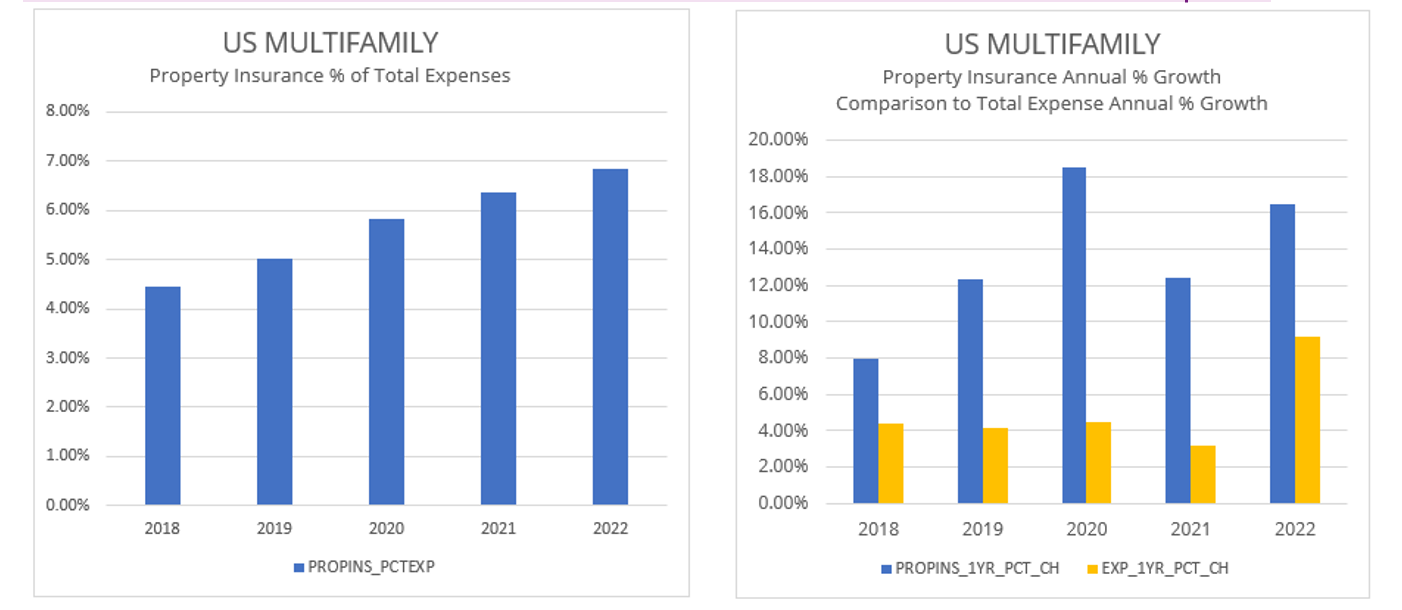
Analyzing market data can help you identify trends, such as regarding supply and demand dynamics, rental rates, and occupancy levels, all which are crucial for portfolio optimization.

Property Valuation Models

Utilizing methods like the discounted cash flow (DCF) analysis allows you to determine the value of your assets, helping you make informed decisions about acquisitions, dispositions, and renovations.

Note: STATVAL™  is proprietary software that extracts and repurposes raw CMBS files for Advanced Statistics and Automated Property-Level Analytics.

Portfolio Performance Modeling

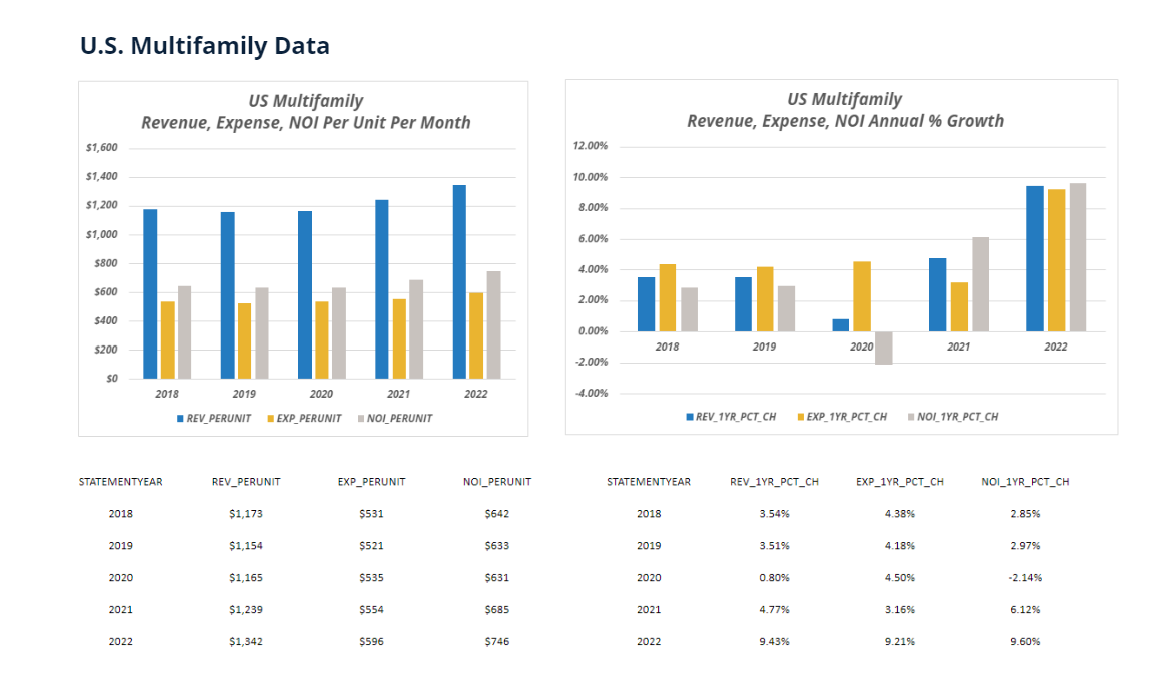
Portfolio performance modeling in commercial real estate is a data-driven approach that involves the analysis and evaluation of a collection of real estate assets within a portfolio. By employing quantitative techniques, historical data, and market insights, it provides a holistic assessment of the portfolio’s financial and operational performance. This modeling helps stakeholders gauge returns, assess risk, diversify assets, benchmark against industry standards, and forecast future cash flows. It enables investors and asset managers to make informed decisions about acquisitions, dispositions, and strategic adjustments, ultimately optimizing the portfolio’s profitability and resilience in a dynamic and competitive real estate market.

Risk Assessment and Sensitivity Analysis

Predicting how your portfolio will perform under various market conditions and identifying potential vulnerabilities is essential for risk management.

Using CRE Financial Modeling and Forecasting to Optimize Performance

There are many types of financial models with a wide range of uses. The output of a financial model is used for decision-making and performing financial analysis, whether inside or outside of the company. Financial modeling can be used to make decisions about:

  • Raising capital (debt and/or equity)
  • Making acquisitions (businesses and/or assets)
  • Growing the business organically (e.g., entering new markets, etc.)
  • Selling or divesting assets and business units
  • Budgeting and forecasting (planning for the years ahead)
  • Capital allocation (priority of which projects to invest in)
  • Valuing a business
  • Financial statement analysis/ratio analysis
  • Management accounting 

Know Where You Stand: Financial Modeling and Forecasting for 2024

An important component of successful budgeting and forecasting is knowing where you stand. By this, we mean understanding your valuations and debts and how they relate to one another. Then, it’s important to assess your property operations, NOI, and cashflow. Finally, you can model your forecasts to optimize your investment.

Take these three actions to help you “know where you stand”:

  1. Produce a market assessment to include a market rate & statistical valuation analysis
  2. Perform asset evaluations, including a comparables analysis, debt forecast, and equity forecast
  3. Model asset, debt, and equity forecasts for high-confidence next steps to communicate to your team & investors

Our team at Thirty Capital Performance Group offers real estate advisory services and provides independent, unbiased insights and recommendations. These services can help you understand where you stand so that you can more accurately prepare your 2024 budget. Contact us today to speak with an expert!

CRE Utilities: Understanding Market Dynamics and Data to Navigate Rising Costs

Every commercial real estate (CRE) property requires that you pay regular maintenance, utilities, facility management, and property taxes. The overall operating costs for a building varies depending on the size of the space, location, and building function. In general, the total operating expenses in a commercial office space, for example, equal about $17.68 per square foot. 

More specifically, utilities like water and electricity contribute significantly to these operating costs. Over the last 5 years, these costs have risen from around 4% to almost 10%, contributing to the ongoing conversation around rising CRE expenses and how to mitigate costs.

Thirty Capital Performance Group’s 2023 State of Multifamily Operations Chartbook can help you make sense of multifamily utility data and apply it to projections across your own portfolio.

Download the 2023 State of Multifamily Operating Performance Chartbook to access your CMSA!

Reviewing the 2023 State of Multifamily Operating Performance Chartbook Data for CRE Utilities

Charts 1 and 2 below show the Utilities Operating Statement line-item as a % of total Expenses and Annual % Growth for both Utilities and Total Expenses aggregated across the full US Multifamily Market.

One can see from Chart 1 that the contribution of the Utility line-item to Total Expenses has been stable at approximately 16% over the last 5 years. Utility expenses can be influenced by many factors including utility rate fluctuations, seasonal demand changes, building energy efficiency, household size, and lifestyle type. Energy-related utilities, such as electricity and gas, exhibit seasonal fluctuations and are more susceptible to short-term supply and demand imbalances in both local and global energy markets. By comparing Chart 2 (US Multifamily Annual % Growth) and Chart 3 (Piped Gas Price in US City Average) below, one can see that annual Utility costs have fluctuated over the past 5 years in a pattern that is consistent in direction (but not in magnitude) with the average price of piped gas in US Cities, as reported by the Federal Reserve and Bureau of Labor Statistics.

Chart 1: Utilities of Total Expenses                        Chart 2: Utilities Annual % Growth

Chart 3: Piped Gas Price in US City Average

Consistent with our Utilities Expense Growth chart, the Fed’s Gas Price chart shows an increase in 2018, stability in 2019 and 2020, followed by a very sharp increase that begins in 2021. Prices now appear to be declining in 2023. Based on this comparison we would expect that growth in the Utilities line-item from 2022 to 2023 will cool and perhaps report negative growth in 2023.

In Chart 4 below we review 2022 Annual Growth for Utilities and Total Expense Growth across the top 20 CMSAs. The table shows the wide disparity across markets with the MN-WI-Minneapolis-St. Paul-Bloomington CMSA topping the list with a whopping increase of 24.42% increase in the Utilities line-item in comparison to a US average of approximately 10% growth (see Chart 2).

 Chart 4: CMSA’s ranked by Growth in the Utilities Line-Item

Source: Thirty Capital Performance Group

With the Utilities expense category representing almost 18% of the Minneapolis expense load, the 24.42% annual growth was a significant contributor to Minneapolis having highest Expense Growth across the 20 CMSAs. The Minneapolis Expense Growth was 12.20% in comparison to the approximately 9.5% for the US Average (see Chart 2).

Continuing with the Minneapolis CMSA as an example, Charts 5 below shows Revenue, Expense, and NOI Growth for 2018-2022. One sees that the high overall Expense Growth combined with sub-par Revenue Growth combined to generate negative NOI Growth (approximately -5%). This compares to approximately 9.5% NOI Growth for the US Average.

 Chart 5: Minneapolis CMSA Revenue, Expense, NOI Growth.

Source: Thirty Capital Performance Group

Minneapolis has some of the coldest temperatures in the US, and natural gas accounts for a disproportionately large percent of total Utility costs in the CMSA. While this example is specific to Minneapolis, it provides an important illustration of distinctive factors that can affect performance in different locales and the importance of studying the data and understanding impacts across all the various expense line-items.

Using Chartbook Data from Larger CMSAs to Apply to Smaller Markets

While a lot of conversations focus on scenarios in states like Texas and Florida, this data is also relevant across markets. As development trends slow down in areas experiencing rising expenses, developers and underwriters are recalibrating their strategies by examining demographic shifts. For instance, as people leave high-cost cities like New York and relocate to more affordable areas like Philadelphia, the commercial real estate market adapts to accommodate these changing preferences and costs of living. In this dynamic landscape, leveraging data, like the 20 CMSAs found in the 2023 State of Multifamily Operating Performance Chartbook, and innovation, such as water use monitoring or automated HVAC systems, are important for navigating rising costs.

Download the Chartbook to choose from 20 CMSAs and start making more informed decisions today. Let’s predict the future together!

About Thirty Capital Performance Group

Thirty Capital Performance Group is a real estate advisory company providing expertise at the intersection of capital markets, technology, data analytics, and data science to deliver results to clients. The multidisciplinary team solves the challenges faced by owners, operators, property managers, asset managers, and institutional investors in validating cashflow and economic assumptions, providing independent, unbiased insights and recommendations.

Contact us today to speak with an expert!

CRE Property Insurance: Understanding Market Impacts and Using Data to Navigate Rising Costs

The commercial property insurance industry generated $254.9 billion in 2022 and is projected to reach $724 billion by 2032, with a compound annual growth rate (CAGR) of 11.3% from 2023 to 2032, according to a new report from Allied Market Research. With expenses, namely property insurance, at a historic high, being able to accurately project your budgets and proformas is critical for knowing where you stand and protecting your cashflow.

Download the 2023 State of Multifamily Operating Performance Chartbook to access a complimentary report for your CMSA!

Understanding CRE Property Insurance: What’s Going On In the Market Today

From owners and operators to asset managers and property managers, everyone involved in commercial real estate (CRE) in some capacity has felt the impacts of rising expenses. Today, the costs of almost everything has risen thanks to inflation, cost of labor, and supply chain shortages. 

Particularly, property insurance has been a topic of conversation as rates continue to increase. When insurance rises to this degree, CRE professionals need to be able to predict and project how this will impact cashflow. In these moments, you need to consider whether the revenue that’s coming in can cover all of your expenses, including insurance-related costs. Additionally, you have to determine whether you can maintain the margin of NOI needed to pay the bills.

In this market, CRE owners and managers are considering opportunities to better mitigate insurance costs. Some alternatives they are using to lower insurance costs are:

  • Opting for less coverage
  • Engaging in pooled options
  • Choosing higher deductibles and paying more out of pocket

As insurance costs continue to rise, you need to be able to determine 1) what next year will look like from a budget perspective and 2) what the next five years will look like as part of your proforma. The data from the 2023 State of Multifamily Operating Performance Chartbook can be used to help you project the future and form a plan.

Reviewing the 2023 State of Multifamily Operating Performance Chartbook Data

The 2023 State of Multifamily Operating Performance Chartbook provides bar chart data for calendar years 2018-2022 with the following data for different segments of the Multifamily Market broken down by Subtype and CMSA:

  • Top-Line Revenue, Expense, and NOI (expressed as $ per unit per month) and Annual % Growth
  • Taxes, Insurance, Utilities, Management Fees, Repairs, and Payroll Operating Statement Line-Items (expressed as a % of total Expenses) and Annual % Growth

The US Multifamily Property Insurance charts below show the property insurance line item as a % of total Expenses and Annual % Growth for both Property Insurance and Total Expenses aggregated across the full US Multifamily Market.

Chart 1: US Multifamily: Property Insurance % of Total Expenses

Chart 2: US Multifamily: Property Insurance Annual % Growth

US Mutlifamily Property Insurance

Source: Thirty Capital Performance Group

One can see that growth in the CRE Property Insurance line-item has grown significantly, as % of Total Expenses and Annual Growth has dwarfed Total Expense in each of the last five years. Insurance growth was 16.48% in 2022 in comparison to the 9.20% Total Expense Growth. Over the last five years, Property Insurance Annual Growth has averaged 13.55% in comparison to 5.09% for Total Expense Growth. The trend reflects the higher and growing number of high payouts on natural disasters, particularly as seen in Florida and Texas. We expect this trend to continue as insurance companies seek to control risk. Another important observation from these charts is the breakout year for Total Expense Growth in 2022, clocking in at 9.20% in comparison to the 5.09% 5yr Average.

Using the Chartbook Data to Navigate Rising CRE Property Insurance Costs

The 2023 State of Multifamily Operating Performance Chartbook provides data that can be used in modeling, proformas, budgets, etc. Underwriters and owners alike can use data from the chartbook as they review their assumptions, rethink their strategies, and create new models. The chartbook data comes in handy because the more specificity you have, the safer and less risky your assumptions will be. Additionally, you can get a more realistic look at what’s going to come out of a particular investment.

Download the Chartbook to choose from 20 CMSAs and start making more informed decisions today. Let’s predict the future together!

Analyzing U.S. Multifamily Data: Revenue, Expenses, and NOI per Unit per Month

The multifamily real estate market in the United States has witnessed significant changes in recent years, driven by economic fluctuations, evolving tenant preferences, and the impact of global events such as the COVID-19 pandemic. Commercial real estate (CRE) asset managers, investors, and owners rely on data to make informed decisions in this dynamic industry. 

In 2022, the money earned from apartment buildings, the money spent on them, and the overall profit all went up a lot, around 9.26%, 9.20%, and 9.30%, respectively. This increase is similar to the rise in the cost of living, which is now the highest it’s been since the early 1980s. In the last five years, the average increase in money earned, money spent, and profit was lower, about 4.38%, 5.09%, and 3.82%, respectively. Since spending more money increased faster than earning more money in recent years, and because prices are still going up more than the government wants, it’s a good idea for investors to carefully check where the spending is going in the apartment business and look at the differences between different types of apartments and places.

In this blog, we will analyze U.S. multifamily data to understand the trends in revenue, expenses, and net operating income (NOI) per unit per month from 2018 to 2022. Using the charts below, we will break down each trend by year.

Revenue Trends

Revenue is a crucial metric for multifamily property owners, as it directly affects profitability. Below is a breakdown of revenue trends over the past five years:

2018:

In 2018, the U.S. multifamily market experienced steady revenue growth, with the average revenue per unit per month increasing by approximately 2.5% compared to 2017. The strong economy and high demand for rental properties contributed to higher rent prices and increased occupancy rates, boosting revenue for property owners.

2019:

2019 continued the upward revenue trajectory, with a similar 2-3% annual increase. Strong job markets and wage growth continued to drive demand for rental housing, enabling property owners to charge higher rents.

2020:

The COVID-19 pandemic had a significant impact on the multifamily market in 2020. With job losses and economic uncertainty, many tenants faced financial hardships, leading to a decrease in rental revenue.Owners and property managers responded with concessions, rent freezes, and other measures to retain tenants, resulting in a slight dip in average revenue per unit.

2021:

As the economy started recovering in 2021, rental revenue rebounded, and some markets experienced a surge in demand. Property owners adjusted their rental strategies, introducing innovative amenities and flexible lease terms to cater to changing tenant preferences.

2022:

In 2022, revenue growth remained strong, with an average increase of around 4% compared to the previous year. The multifamily market adapted to the post-pandemic environment, with a focus on technology and sustainability, which allowed property owners to command higher rents.

Expense Trends

Understanding expenses is crucial for property owners to manage their cash flow effectively. Below is a look at the trends in multifamily property expenses:

2018-2019:

Operating expenses for multifamily properties remained relatively stable during these years.

Maintenance, property management, and utilities continued to be the primary components of expenses.

2020:

The pandemic disrupted expense patterns, with increased spending on cleaning and sanitation, PPE for staff, and reduced maintenance due to lockdowns. Property owners faced challenges in balancing expenses while accommodating tenant needs.

2021:

In 2021, as the economy improved, some expenses related to COVID-19 precautions decreased, but labor and supply chain challenges led to increased maintenance costs. Rising construction and material costs also impacted capital expenditures for property renovations.

2022:

By 2022, expenses had stabilized, with property owners optimizing operations and embracing technology to streamline management and reduce costs. Some expenses remained elevated, particularly in markets where labor shortages persisted.

Net Operating Income (NOI) Trends

NOI is a key metric that reflects a property’s profitability. It is calculated by subtracting operating expenses from revenue. Below is how NOI per unit per month evolved from 2018 to 2022:

2018-2019: 

NOI steadily increased, reflecting the growth in rental revenue.

2020: 

NOI experienced a dip due to decreased revenue and increased expenses during the pandemic.

2021-2022: 

As the multifamily market rebounded and expenses stabilized, NOI recovered and surpassed pre-pandemic levels.

Analyzing U.S. multifamily data from 2018 to 2022 reveals a resilient industry that adapted to the challenges posed by the COVID-19 pandemic. While revenue experienced fluctuations, property owners who effectively managed expenses and embraced innovation were able to maintain or even improve their NOI. However, 2023 has presented new challenges that we must learn to navigate including high interest rates, rising cap rates, and decreased transaction volume.

Investors and industry professionals must continue to monitor these trends closely to make informed decisions in this ever-changing multifamily market. Adapting to tenant preferences, implementing cost-effective technologies, and staying responsive to economic shifts will be key to success in the years ahead.

About the Multifamily Operating Performance Chartbook

The Chartbook includes bar chart data for calendar years 2018-2022 providing the following data for different segments of the Multifamily Market broken down by Subtype and CMSA:

  • Top-Line Revenue, Expense, and NOI (expressed as $ per unit per month and Annual % Growth)
  • Taxes, Insurance, Utilities, Management Fees, Repairs, and Payroll Operating Statement Line-Items (expressed as a % of total Expenses and Annual % Growth).

Download the Chartbook to choose from 20 CMSAs and start making more informed decisions today. Let’s predict the future together!

Exclusive Sneak Peek: 2023 State of Multifamily Operating Performance Chartbook

In this article, we introduce our 2023 State of Multifamily Operating Performance Chart Book and provide some big picture takeaways. Later, we will discuss data and insights related to specific Operating Statement Line-Items, Multifamily Subtypes, and CMSAs. 

We encourage you to sign up to be notified once the chartbook is released. In the meantime, read ahead for a sneak peek of what you can expect from the chartbook!

Sign up to be notified when the Chartbook is available!

What is the Multifamily Operating Performance Chartbook?

The Chartbook includes bar chart data for calendar years 2018-2022 providing the following data for different segments of the Multifamily Market broken down by Subtype and CMSA:

  • Top-Line Revenue, Expense, and NOI (expressed as $ per unit per month and Annual % Growth)
  • Taxes, Insurance, Utilities, Management Fees, Repairs, and Payroll Operating Statement Line-Items (expressed as a % of total Expenses and Annual % Growth).

How can the Multifamily Operating Performance Chartbook benefit commercial real estate firms?

The Chartbook visualizes 2023 trends that can be used to help your firm better predict and prepare for what will happen in the next 12-24 months. Being able to forecast what’s coming can help you better maintain cashflow and navigate the ever-changing market. Additionally, insights from the Chartbook can help you update and forecast proformas with better accuracy and communicate your findings with  investors and stakeholders.

What type of charts can you find in the chartbook?

The charts below show the Top-Line figures for the full US Multifamily Market:

According to the charts, multifamily revenue, expenses, and net operating income (NOI) each experienced historically high growth in 2022, clocking in at 9.26%, 9.20%, and 9.30% respectively. This growth is consistent with the surge in macroeconomic measures of inflation to the highest level since the early 1980s. Over the past five years, average revenue, expenses, and NOI growth were 4.38%, 5.09%, and 3.82% respectively. With expense growth greater than revenue growth over these recent time periods, and with inflation still above the Federal Reserve target rate, investors can benefit from closely looking at the contributions to expense growth across operating statement line-items, as well as to differences across multifamily subtypes and geographic regions.

The next set of charts shows individual Operating Statement Line-Items for the full US Multifamily Market:

Real Estate Taxes:

Taxes and Payrolls are the largest contributors to expenses, totaling approximately 45% of the total expense load. Of the six operating statement line items explored in this report, 2022 annual growth in taxes of 3.68% is the only line item with less than 8% 2022 growth. Over the past five years, taxes increased on average 4.51%. This growth is broadly consistent with other operating statement line items apart from property insurance, which has consistently exceeded other line items by a wide margin. Tax increases tend to track property value changes, so the more moderate 2022 growth may well reflect the offsetting impacts of rising NOI and higher cap rates due to the sharp rise in interest rates.

Property Insurance:

Growth in property insurance dwarfed that of other operating statement line items both in 2022 and in each of the last five years. Insurance growth was 16.48% in 2022 in comparison to the 9.20% aggregate expense growth. Over the last five years, insurance growth has averaged 13.55% in comparison to the 4- 5% range for each of the other operating statement line items. The trend reflects the higher and growing number of high payouts on natural disasters, particularly as seen in Florida and Texas. We expect this trend to continue as insurance companies seek to control risk.

Utilities, Property Management Fees, Payroll:

These three categories tended to track aggregate revenue and expense growth with greater than 80% correlation over the recent five-year history. The correlation of management fee growth to revenue growth was almost 100%, owing to it typically being calculated as a percentage of revenue. Payroll has a similarly high correlation to aggregate revenue growth.

Repairs:

Growth in repairs had a notable response to the supply constraints and social distancing during COVID, with a year-over-year decline of 3.48% in 2020 and sharp bounce-back in 2021 and 2022. It appears that apartment owners on average postponed repairs until the COVID-induced constraints resided.

These are major big-picture takeaways for the full US Multifamily Market. In subsequent posts we will drill down into major Multifamily Subtypes and CMSAs and explore differences and similarities in operating performance across the various market segments. The database used for these analyses comprises 45,000+ Lender Underwritten Financials and Appraised Values, and 150,000+ serialized Operating Statements extracted from Multifamily CMBS Offering Circulars and Trustee Reports. The primary database concentration is Garden style apartments serving middle income households. The database also includes significant groupings of Mid-Rise, High-Rise, Senior, Healthcare, Student, and Manufactured Housing.

About Thirty Capital Performance Group

Thirty Capital Performance Group is a real estate advisory company providing expertise at the intersection of capital markets, technology, data analytics, and data science to deliver results to clients. The multidisciplinary team solves the challenges faced by owners, operators, property managers, asset managers, and institutional investors in validating cashflow and economic assumptions, providing independent, unbiased insights and recommendations.

Sign up to be notified when the Chartbook is available!

In the meantime, contact the Thirty Capital Performance Group team for a more granular analysis of your individual assets. 

Strategies for CRE Asset Managers to Assess Portfolio Performance and Set Investor Expectations

A thorough portfolio review can help you assess your commercial real estate (CRE) portfolio’s performance to determine what’s working and what isn’t, identify opportunities for improvement, and mitigate any risk. With greater visibility, you can identify actionable next steps and develop effective strategies to navigate the current market cycle. Your comprehensive mid-year portfolio review is also a good time to compile key reports for your investors, ensuring they have the information they need to stay on track to achieve their financial goals and feel confident about their investment. In this article, we will discuss things to consider as you assess your portfolio and prepare to answer tough questions from your investors.

Performance Analysis

TCPG service: Property and Portfolio Optimization Reporting

Using our Owned Property List, we perform either a single property optimization report, a portfolio optimization report, or both reports if desired.

Learn more

Performance analysis plays a pivotal role in enhancing the effectiveness of asset managers by providing a comprehensive and data-driven understanding of their investment strategies and portfolio outcomes. By meticulously evaluating the historical performance of various assets, sectors, and market trends, asset managers can discern patterns, identify strengths, and pinpoint areas for improvement in their investment approach. This analytical process aids in optimizing asset allocation, risk management, and decision-making, enabling asset managers to align their strategies with market dynamics and investor objectives. Furthermore, performance analysis fosters transparency and accountability, facilitating better communication with key stakeholders. Ultimately, a robust performance analysis empowers asset managers to fine-tune their investment strategies, maximize returns, and navigate the complexities of the financial landscape with confidence.

Market Trends and Research

TCPG service: Market Analysis

We provide a comparison of operating statements for 5-10 comp properties in the market you provide by giving insights to operating costs, year built, number of units, area demographics, etc. With this information, you can see how you stack up

Learn more

Market trends and diligent research can be combined to help you understand your portfolio’s performance. By staying attuned to prevailing market dynamics, shifts in demand, and emerging industry trends, asset managers can strategically align their portfolio composition and investment strategies to capitalize on emerging opportunities. Thorough research empowers asset managers to identify high-potential sectors, geographic markets, and property types, thereby optimizing asset allocation decisions. Moreover, a deep understanding of market trends aids in accurate risk assessment, enabling asset managers to proactively mitigate potential threats and navigate market volatilities. By integrating comprehensive research and insights into their decision-making process, CRE asset managers can refine their portfolio mix, enhance property value, and ultimately achieve superior returns for their firm.

Peer-to-Peer Dashboards and Benchmarks

Asset Management Reporting

We provide a monthly financial package review with preparation of an Asset Management Report. Additional services available upon request.

Learn more

Asset managers are responsible for delivering timely, accurate reports and improving asset performance. Understanding your property’s performance in relation to the market can create a competitive advantage. But sourcing and merging raw third-party data for an apples-to-apples comparison can be time-consuming.​ Thirty Capital Performance Group can help you benchmark your portfolio’s performance against market benchmarks for easy one-to-one comparisons of property performance.

How Thirty Capital Performance Group Can Help

Thirty Capital Performance Group is a real estate advisory company providing expertise at the intersection of capital markets, technology, data analytics, and data science to deliver results to clients. The multidisciplinary team solves the challenges faced by owners, operators, property managers, asset managers, and institutional investors in validating cashflow and economic assumptions, providing independent, unbiased insights and recommendations.

Reports and services we offer include:

  • Asset management reporting
  • Market analysis
  • Property and portfolio optimization reporting
  • Valuation/cap rate reports

Contact us today to speak with an expert!

Incomplete CRE Data and Reports Can Limit Effective Investor Communications

In commercial real estate (CRE), accurate and timely data is crucial for making informed decisions. And with today’s market uncertainty, investors are becoming more involved and want access to consistent, updated reports. Now, it is critical to be aware of common CRE data and reporting challenges and identify if they are present in your firm. If they are, you must identify opportunities to overcome these challenges and ensure they don’t hinder you or your investors from accessing the right information at the right time.

Read ahead as we identify some of the common data and reporting challenges and provide tips for how to effectively overcome them.

Common CRE Data and Reporting Challenges

Data Challenge #1: Disparate and Unstructured Data

Disparate data refers to a collection of data that is distinctly different. When this is the case, it becomes difficult to extract meaning or value from the data. Unstructured data refers to data that is usually not easily searchable (typically anything that is not 100% text and often lives in an application rather than a database or data warehouse).

Today, most data is unorganized and uncategorized, creating a pool of disparate and unstructured data. In fact, unstructured data comprises 80% of enterprise data. The problem with using disparate and unstructured data is that, without integrations to add context, the value that can be extracted from the data is limited. 

Disparate, unstructured data impacts how commercial real estate firms derive actionable, meaningful portfolio insights. For example, nonaggregated property data can create inaccuracies in your reporting, which can in turn impact critical metrics like your operating expense ratio or NOI and lead to inefficiencies in the firm.

Data Challenge #2: Data Silos

Today, roughly 75% of the commercial real estate industry struggles with data silos. Data silos are a group of raw data that is accessible by one department or group but isolated from the rest of the organization. 

Whatever the cause, data silos can impact your organization’s productivity, data integrity, and revenue, as well as limit transparency. Over time, data silos can create misalignment across the firm as team members use differing datasets and information. For example, if an asset manager and property manager have different information, occupancy rate discrepancies could occur, which could impact income for the following months. Additionally, data silos create inconsistencies in information, which could tarnish the firm’s credibility amongst investors and other stakeholders.

Data Challenge #3: Data Inaccuracies and Errors

For decades, the commercial real estate industry has relied on spreadsheets for data entry, financial reporting, and other critical business functions. However, today it is known that 9 out of 10 spreadsheets contain at least one mistake, such as mistyped numbers, incorrect formulas, rounding errors, and incorrect cell references. One wrong data entry or deleted number can expose your firm to risks such as missed portfolio opportunities, noncompliance, and revenue loss (amongst many other issues). 

Data Challenge #4: Data Variability

Today, the asset manager (or analyst) is accountable for taming the variability of data about or around the asset as it flows into the management or ownership organization. This manual

workflow requires continual efforts to ensure that the data is standardized to the way the organization (or other stakeholders) want to understand it. 

Data Challenge #5: Data Analysis

Today, the asset manager (or analyst) is often responsible for creating all reporting about the performance of the asset, enabling the flow of information up, down, and across the organization. Often, these reports rely on disjointed data timing, source, and availability, affecting consistency and trust in the analysis. Given the burdens in aggregating and standardizing the data, asset managers struggle with speed and effort as they spend more time trying to collect the data than in the actual analysis of the information to get to an informed decision or action. This results in increased risk for non-optimal outcomes.

6 Steps to Overcome Data and Reporting Challenges in CRE

Step 1: Identify and Understand the Challenges

The first step in overcoming data and reporting challenges is to identify and understand the specific issues you are facing. These may include data inconsistency, lack of standardization, data silos, outdated reporting tools, limited data access, or poor data quality. By pinpointing the challenges, you can devise effective strategies to address them.

Step 2: Establish Robust Data Governance Policies

Effective data governance is the foundation for effectively managing CRE data. Create clear policies and procedures that govern data availability, usability, integrity, and security. Establish data standards and implement data validation processes to ensure consistency and accuracy across all systems and platforms.

Step 3: Leverage Technology for Data Management

Investing in the right technology can significantly streamline data management and reporting processes. Consider adopting a powerful customer relationship management (CRM) system, property management software, or data analytics tools tailored specifically for the real estate industry. These tools can facilitate efficient data collection, organization, and reporting, enabling you to make data-driven decisions. 

Note: Lobby CRE can centralize your operational and financial data for complete portfolio visibility. Learn how!

Step 4: Integrate Systems and Data Sources

Data silos can impede the flow of information and hinder effective reporting. Integrate disparate systems and data sources within your organization to eliminate redundancies and enhance data sharing. Explore system integration options or invest in a centralized data management platform that can aggregate data from various sources, ensuring a holistic view of your CRE portfolio.

Step 5: Enhance Data Quality

High-quality data is essential for reliable reporting and analysis. Implement data quality controls to ensure accuracy and completeness. Regularly clean and validate your data, address any data entry errors, and establish data quality metrics to monitor and measure accuracy over time. By maintaining data integrity, you can improve the reliability of your reports and make more informed decisions.

Step 6: Provide Training and Support

Data and reporting challenges often stem from a lack of knowledge or skills among employees. Offer training programs to enhance data literacy and reporting capabilities within your organization. Invest in ongoing support and provide resources such as data visualization tools or reporting templates to assist employees in creating accurate and insightful reports.

Step 7: Use a Service-Provider to Help with Your Reporting

At Thirty Capital Performance Group, our experienced team of Analysts, Asset Managers, and Real Estate Professionals review your asset management reports for unbiased third-party insights about your property’s performance and your overall portfolio management.

How Thirty Capital Performance Group Can Help

Thirty Capital Performance Group is a real estate advisory company providing expertise at the intersection of capital markets, technology, data analytics, and data science to deliver results to clients. The multidisciplinary team solves the challenges faced by owners, operators, property managers, asset managers, and institutional investors in validating cashflow and economic assumptions, providing independent, unbiased insights and recommendations.

Reports we offer include:

  • Asset management reporting
  • Market analysis
  • Property and portfolio optimization reporting
  • Valuation/cap rate reports

Contact us today to speak with an expert!