Exclusive Sneak Peek: 2023 State of Multifamily Operating Performance Chartbook
In this article, we introduce our 2023 State of Multifamily Operating Performance Chart Book and provide some big picture takeaways. Later, we will discuss data and insights related to specific Operating Statement Line-Items, Multifamily Subtypes, and CMSAs.
We encourage you to sign up to be notified once the chartbook is released. In the meantime, read ahead for a sneak peek of what you can expect from the chartbook!
Sign up to be notified when the Chartbook is available!
What is the Multifamily Operating Performance Chartbook?
The Chartbook includes bar chart data for calendar years 2018-2022 providing the following data for different segments of the Multifamily Market broken down by Subtype and CMSA:
- Top-Line Revenue, Expense, and NOI (expressed as $ per unit per month and Annual % Growth)
- Taxes, Insurance, Utilities, Management Fees, Repairs, and Payroll Operating Statement Line-Items (expressed as a % of total Expenses and Annual % Growth).
How can the Multifamily Operating Performance Chartbook benefit commercial real estate firms?
The Chartbook visualizes 2023 trends that can be used to help your firm better predict and prepare for what will happen in the next 12-24 months. Being able to forecast what’s coming can help you better maintain cashflow and navigate the ever-changing market. Additionally, insights from the Chartbook can help you update and forecast proformas with better accuracy and communicate your findings with investors and stakeholders.
What type of charts can you find in the chartbook?
The charts below show the Top-Line figures for the full US Multifamily Market:

According to the charts, multifamily revenue, expenses, and net operating income (NOI) each experienced historically high growth in 2022, clocking in at 9.26%, 9.20%, and 9.30% respectively. This growth is consistent with the surge in macroeconomic measures of inflation to the highest level since the early 1980s. Over the past five years, average revenue, expenses, and NOI growth were 4.38%, 5.09%, and 3.82% respectively. With expense growth greater than revenue growth over these recent time periods, and with inflation still above the Federal Reserve target rate, investors can benefit from closely looking at the contributions to expense growth across operating statement line-items, as well as to differences across multifamily subtypes and geographic regions.
The next set of charts shows individual Operating Statement Line-Items for the full US Multifamily Market:
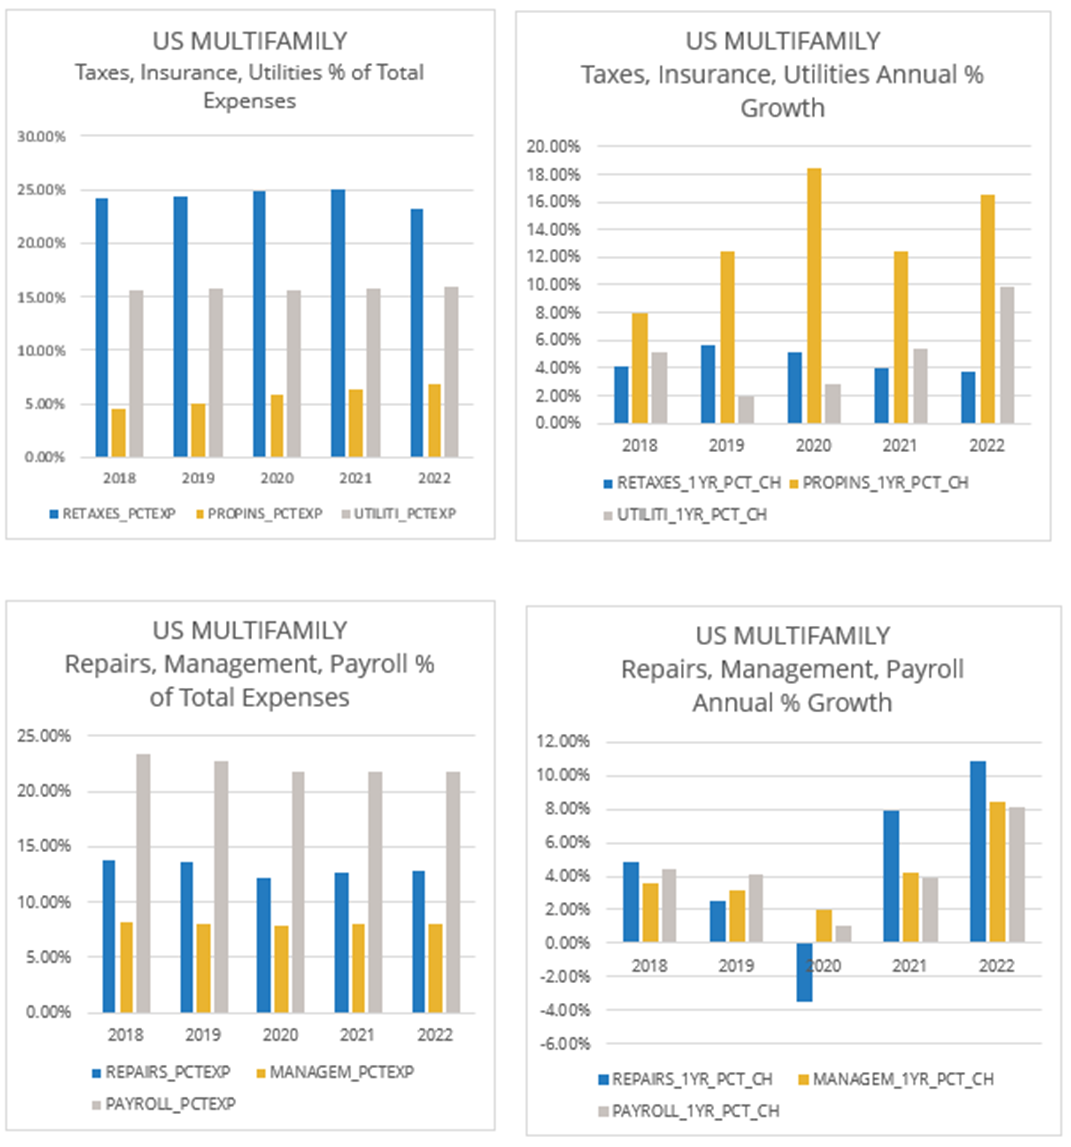
Real Estate Taxes:
Taxes and Payrolls are the largest contributors to expenses, totaling approximately 45% of the total expense load. Of the six operating statement line items explored in this report, 2022 annual growth in taxes of 3.68% is the only line item with less than 8% 2022 growth. Over the past five years, taxes increased on average 4.51%. This growth is broadly consistent with other operating statement line items apart from property insurance, which has consistently exceeded other line items by a wide margin. Tax increases tend to track property value changes, so the more moderate 2022 growth may well reflect the offsetting impacts of rising NOI and higher cap rates due to the sharp rise in interest rates.
Property Insurance:
Growth in property insurance dwarfed that of other operating statement line items both in 2022 and in each of the last five years. Insurance growth was 16.48% in 2022 in comparison to the 9.20% aggregate expense growth. Over the last five years, insurance growth has averaged 13.55% in comparison to the 4- 5% range for each of the other operating statement line items. The trend reflects the higher and growing number of high payouts on natural disasters, particularly as seen in Florida and Texas. We expect this trend to continue as insurance companies seek to control risk.
Utilities, Property Management Fees, Payroll:
These three categories tended to track aggregate revenue and expense growth with greater than 80% correlation over the recent five-year history. The correlation of management fee growth to revenue growth was almost 100%, owing to it typically being calculated as a percentage of revenue. Payroll has a similarly high correlation to aggregate revenue growth.
Repairs:
Growth in repairs had a notable response to the supply constraints and social distancing during COVID, with a year-over-year decline of 3.48% in 2020 and sharp bounce-back in 2021 and 2022. It appears that apartment owners on average postponed repairs until the COVID-induced constraints resided.
These are major big-picture takeaways for the full US Multifamily Market. In subsequent posts we will drill down into major Multifamily Subtypes and CMSAs and explore differences and similarities in operating performance across the various market segments. The database used for these analyses comprises 45,000+ Lender Underwritten Financials and Appraised Values, and 150,000+ serialized Operating Statements extracted from Multifamily CMBS Offering Circulars and Trustee Reports. The primary database concentration is Garden style apartments serving middle income households. The database also includes significant groupings of Mid-Rise, High-Rise, Senior, Healthcare, Student, and Manufactured Housing.
About Thirty Capital Performance Group
Thirty Capital Performance Group is a real estate advisory company providing expertise at the intersection of capital markets, technology, data analytics, and data science to deliver results to clients. The multidisciplinary team solves the challenges faced by owners, operators, property managers, asset managers, and institutional investors in validating cashflow and economic assumptions, providing independent, unbiased insights and recommendations.
Sign up to be notified when the Chartbook is available!
In the meantime, contact the Thirty Capital Performance Group team for a more granular analysis of your individual assets.