CRE Peer-to-Peer Benchmarks: Definitions, Best Practices, and Impacts
Uncertainty looms large in today’s commercial real estate (CRE) market, often leading owners/operators, asset managers, property managers, and others to make decisions based on assumptions rather than facts. For example, waiting for interest rates to drop can be a risky strategy. CRE Peer-to-Peer Benchmarks, specifically tailored for multifamily properties, offer you a more insightful perspective of your portfolio as it relates to the market, allowing you to make fact-based decisions and implement meaningful strategies for your next move in your portfolio.
Understanding the answer to the question “is it me or the market?” is essential. Continue reading to learn how you can uncover the truth about your portfolio through CRE Peer-to-Peer Benchmarks.
Understanding CRE Peer-to-Peer Benchmarks
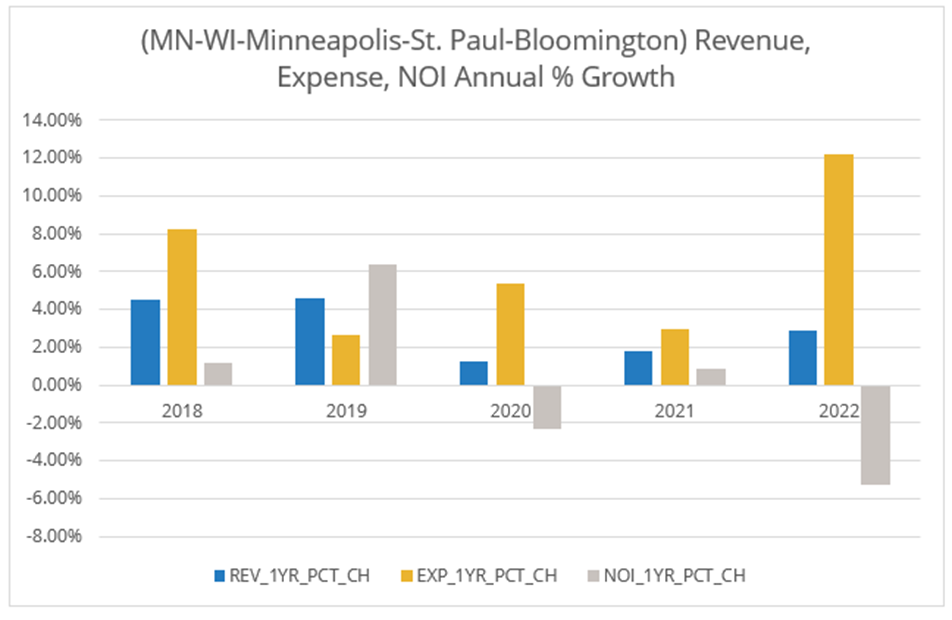
At their core, CRE Peer-to-Peer Benchmarks involve comparing your property’s performance with similar properties in your neighborhood or city. By leveraging property operating statements, these benchmarks allow you to assess how you compare with regards to revenue, expenses, NOI, and other key performance metrics. Whetheryou opt for automated selection or hand-pick comparable properties, the goal remains the same: gaining a deeper understanding of your property’s performance within the broader market landscape.
Defining Peer-to-Peer Benchmarks
The effectiveness of Peer-to-Peer Benchmarks lies in their ability to provide meaningful insights. By accurately defining the parameters of comparison, such as property type, location, and size, these benchmarks ensure relevance and accuracy. Additionally, incorporating key performance indicators (KPIs) relevant to the CRE industry enhances the depth of analysis and facilitates actionable decision-making.
Key Metrics and Data Accuracy
Key metrics commonly used in Peer-to-Peer Benchmarks for CRE include:
- Core Property Attributes
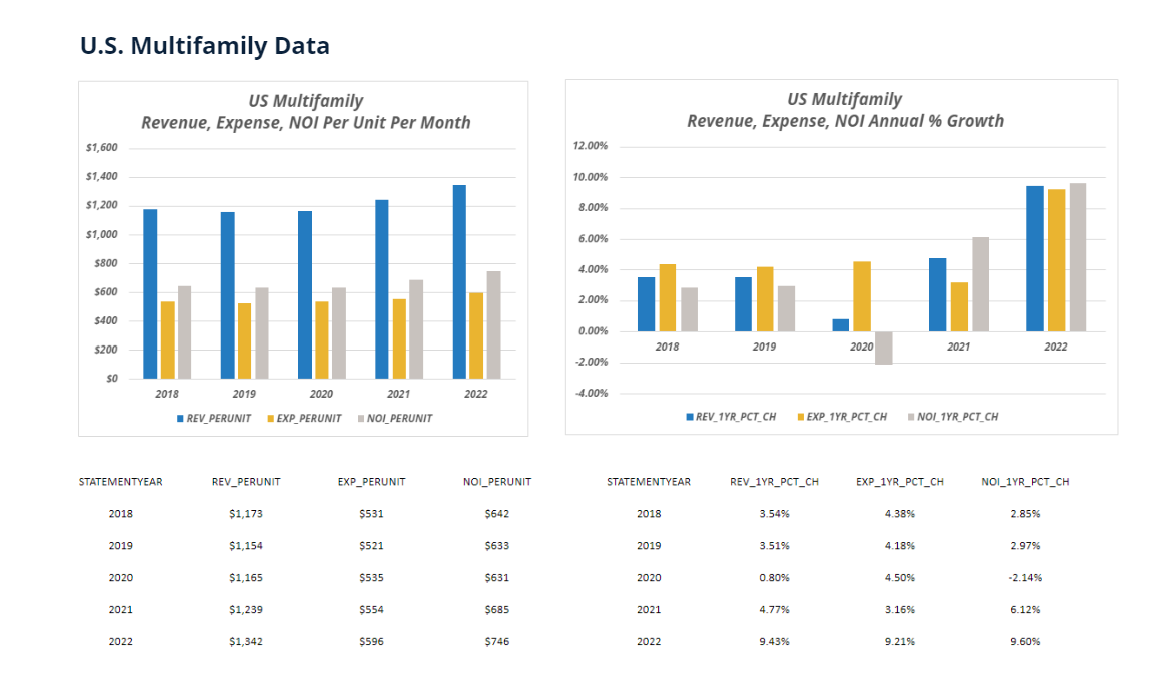
- Top-Line Financials
- Revenue
- Expenses
- NOI
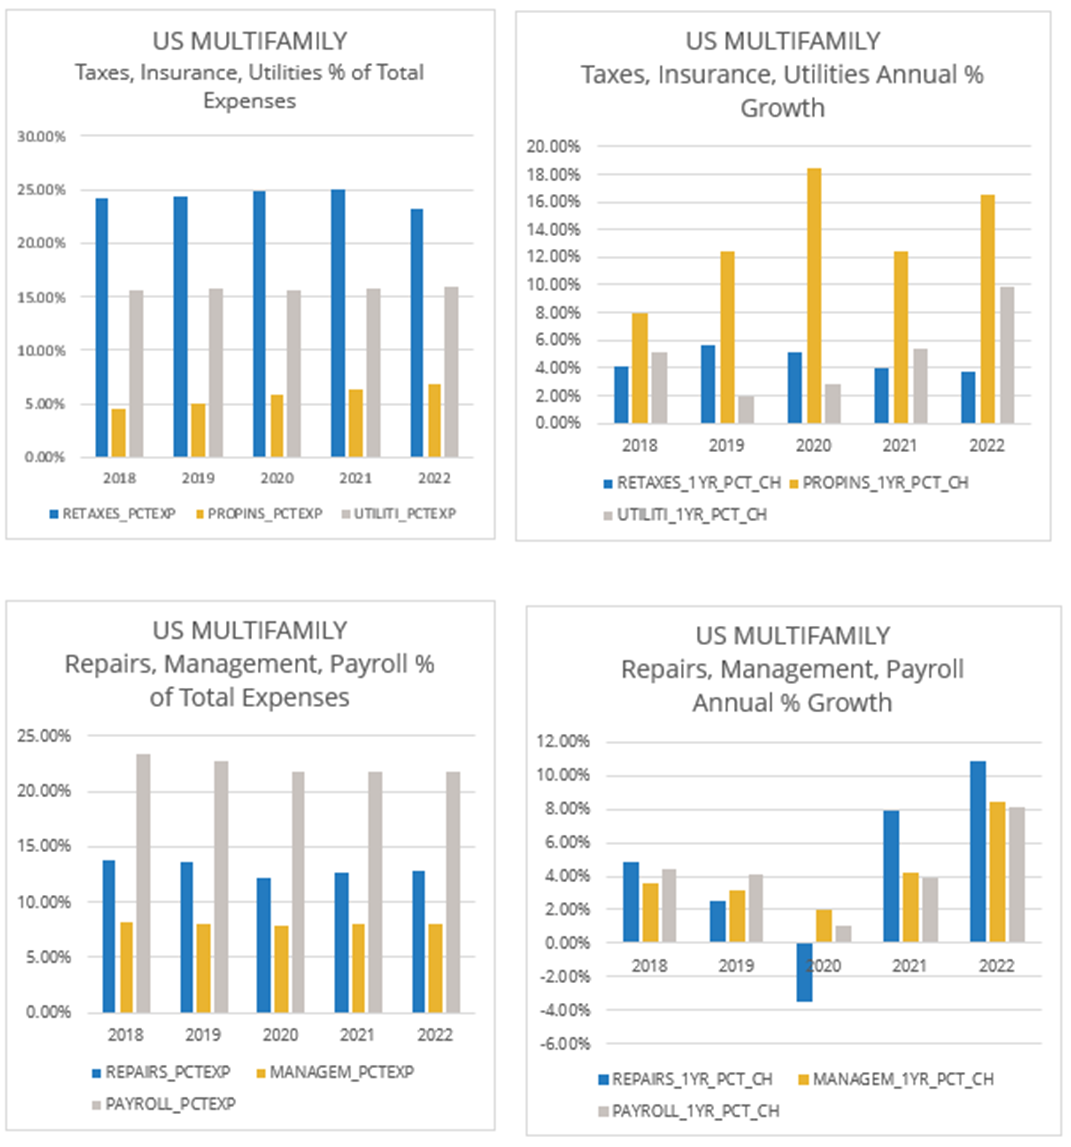
- Expense Line-Items
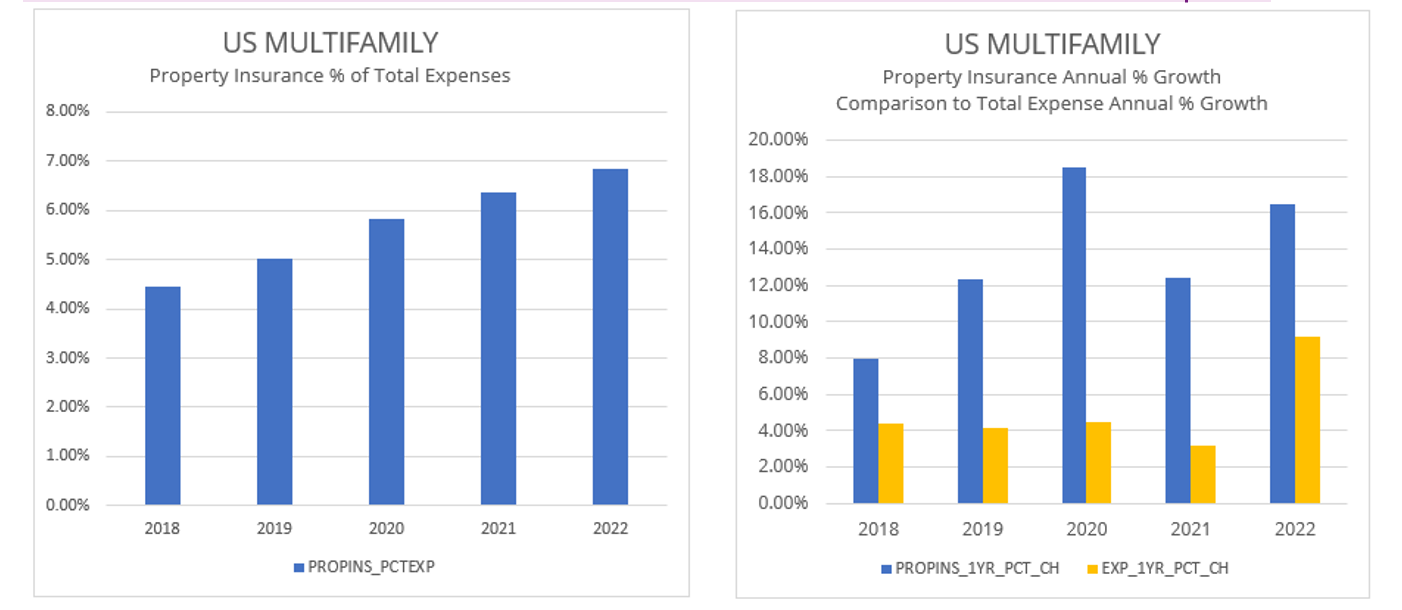
- Insurance
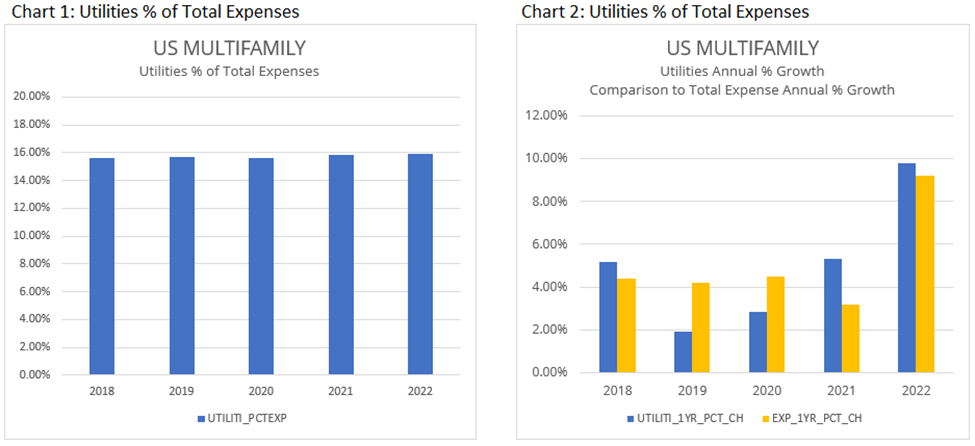
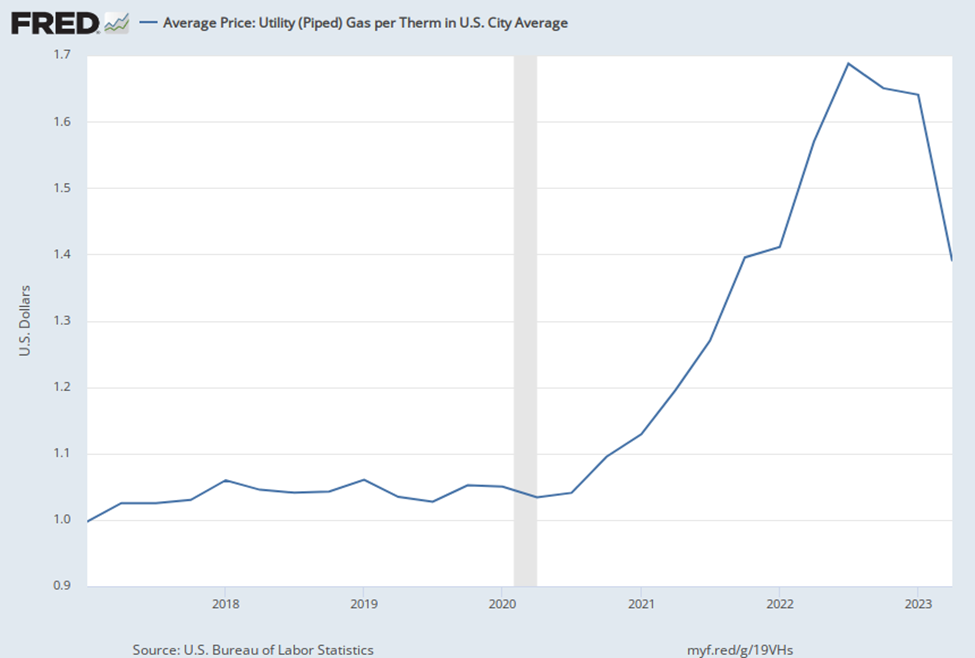
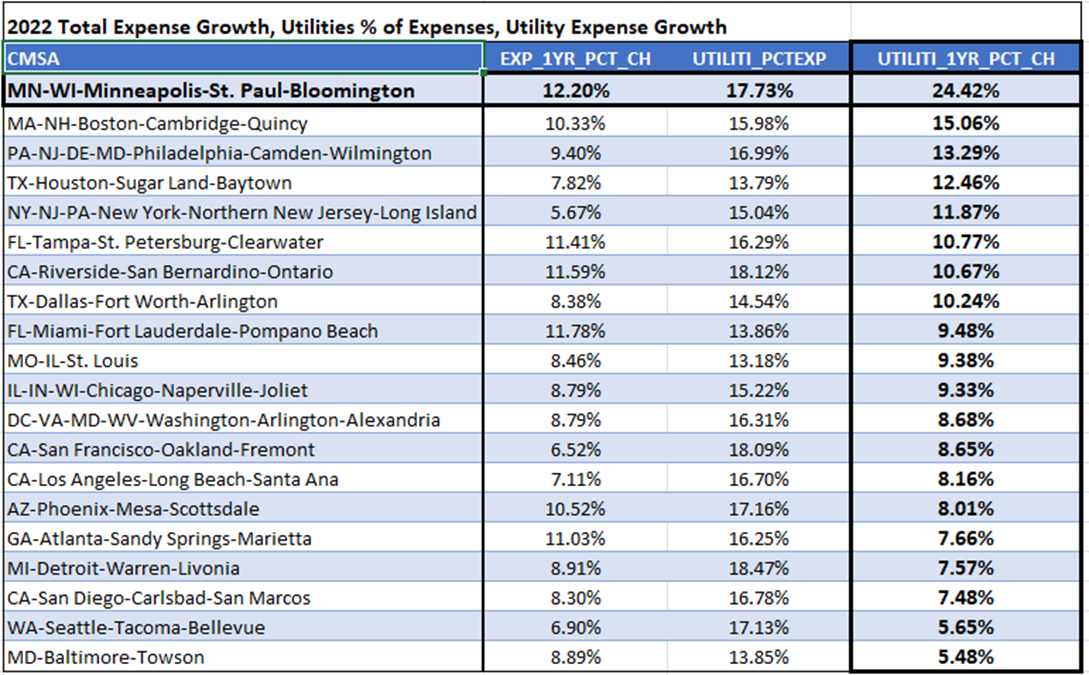
- Utilities
- Repairs
Ensuring data accuracy is crucial in peer-to-peer benchmarking initiatives. CRE professionals can achieve this by:
- Collaborating with reputable providers
- Validating data sources and methodologies
- Regularly updating benchmarking criteria and parameters
Best Practices for Peer-to-Peer Benchmarks
One of the current challenges faced by CRE professionals is accessing reliable and comprehensive data for benchmarking purposes. Traditional methods often rely on outdated or incomplete information, leading to skewed comparisons and inaccurate conclusions. However, by leveraging tools like the Thirty Capital Statistical Valuation System (STATVAL) and conducting peer-to-peer benchmark analyses on a quarterly or biannual basis, CRE professionals can overcome these challenges and drive meaningful improvements in property performance.
Leveraging Benchmark Data
By comparing your revenue and expenses to those of similar properties, you can identify areas of overperformance and underperformance compared to the market. Regularly running these reports not only ensures you move with the market, but it also provides a clear roadmap to proactively make moves and help you outperform the market.
Understanding your revenue position in relation to other properties in the report will allow you to identify any opportunities for revenue growth. Similarly, assessing expenses can help determine if your property is in line with market norms or if it’s an outlier, indicating potential areas for improvement. By pinpointing areas of underperformance and learning from top performers, CRE professionals can implement targeted strategies to optimize their property’s performance and maintain competitiveness in the market.
Fostering Transparency and Accountability
Overall, Peer-to-Peer Benchmarks foster a culture of accountability within the CRE industry. By promoting data-driven decision-making and benchmarking best practices, these initiatives facilitate greater transparency in market performance, pricing trends, and operational efficiencies. Moreover, by holding stakeholders accountable for their performance relative to industry peers, Peer-to-Peer Benchmarks drive continuous improvement and innovation, ultimately benefiting the entire CRE ecosystem.
The Impact of Peer-to-Peer Benchmarks
Peer-to-peer benchmarks are pivotal in shaping decision-making processes within CRE organizations. By offering objective insights into market trends, competitor performance, and improvement areas, they empower stakeholders to make informed decisions in line with strategic objectives.
They are instrumental in helping you answer the question: “Is it me or the market?”
This information allows for clear identification of underperformance areas and a roadmap to outperform the market. Peer-to-peer benchmarks enable fact-based decision-making and strategy formulation. In navigating the real estate market, they optimize rental pricing, reduce operating expenses, and identify portfolio expansion opportunities. Leveraging data-driven analyses, stakeholders overcome market uncertainties. Moreover, these benchmarks foster a culture of transparency, accountability, and continuous improvement, encouraging broader participation and easing anxieties through robust security measures to unlock property potential and ensure lasting success.
Request a Peer-to-Peer Benchmark Report from Thirty Capital Performance Group
Are you ready to elevate your property to greater success? At Thirty Capital Performance Group, we provide tools, services, and recommendations tailored to your property’s unique needs. Contact us today to request a sample benchmarking report or download our complimentary performance chartbook.