CRE Property Insurance: Understanding Market Impacts and Using Data to Navigate Rising Costs
The commercial property insurance industry generated $254.9 billion in 2022 and is projected to reach $724 billion by 2032, with a compound annual growth rate (CAGR) of 11.3% from 2023 to 2032, according to a new report from Allied Market Research. With expenses, namely property insurance, at a historic high, being able to accurately project your budgets and proformas is critical for knowing where you stand and protecting your cashflow.
Understanding CRE Property Insurance: What’s Going On In the Market Today
From owners and operators to asset managers and property managers, everyone involved in commercial real estate (CRE) in some capacity has felt the impacts of rising expenses. Today, the costs of almost everything has risen thanks to inflation, cost of labor, and supply chain shortages.
Particularly, property insurance has been a topic of conversation as rates continue to increase. When insurance rises to this degree, CRE professionals need to be able to predict and project how this will impact cashflow. In these moments, you need to consider whether the revenue that’s coming in can cover all of your expenses, including insurance-related costs. Additionally, you have to determine whether you can maintain the margin of NOI needed to pay the bills.
In this market, CRE owners and managers are considering opportunities to better mitigate insurance costs. Some alternatives they are using to lower insurance costs are:
- Opting for less coverage
- Engaging in pooled options
- Choosing higher deductibles and paying more out of pocket
As insurance costs continue to rise, you need to be able to determine 1) what next year will look like from a budget perspective and 2) what the next five years will look like as part of your proforma. The data from the 2023 State of Multifamily Operating Performance Chartbook can be used to help you project the future and form a plan.
Reviewing the 2023 State of Multifamily Operating Performance Chartbook Data
The 2023 State of Multifamily Operating Performance Chartbook provides bar chart data for calendar years 2018-2022 with the following data for different segments of the Multifamily Market broken down by Subtype and CMSA:
- Top-Line Revenue, Expense, and NOI (expressed as $ per unit per month) and Annual % Growth
- Taxes, Insurance, Utilities, Management Fees, Repairs, and Payroll Operating Statement Line-Items (expressed as a % of total Expenses) and Annual % Growth
The US Multifamily Property Insurance charts below show the property insurance line item as a % of total Expenses and Annual % Growth for both Property Insurance and Total Expenses aggregated across the full US Multifamily Market.
Chart 1: US Multifamily: Property Insurance % of Total Expenses
Chart 2: US Multifamily: Property Insurance Annual % Growth
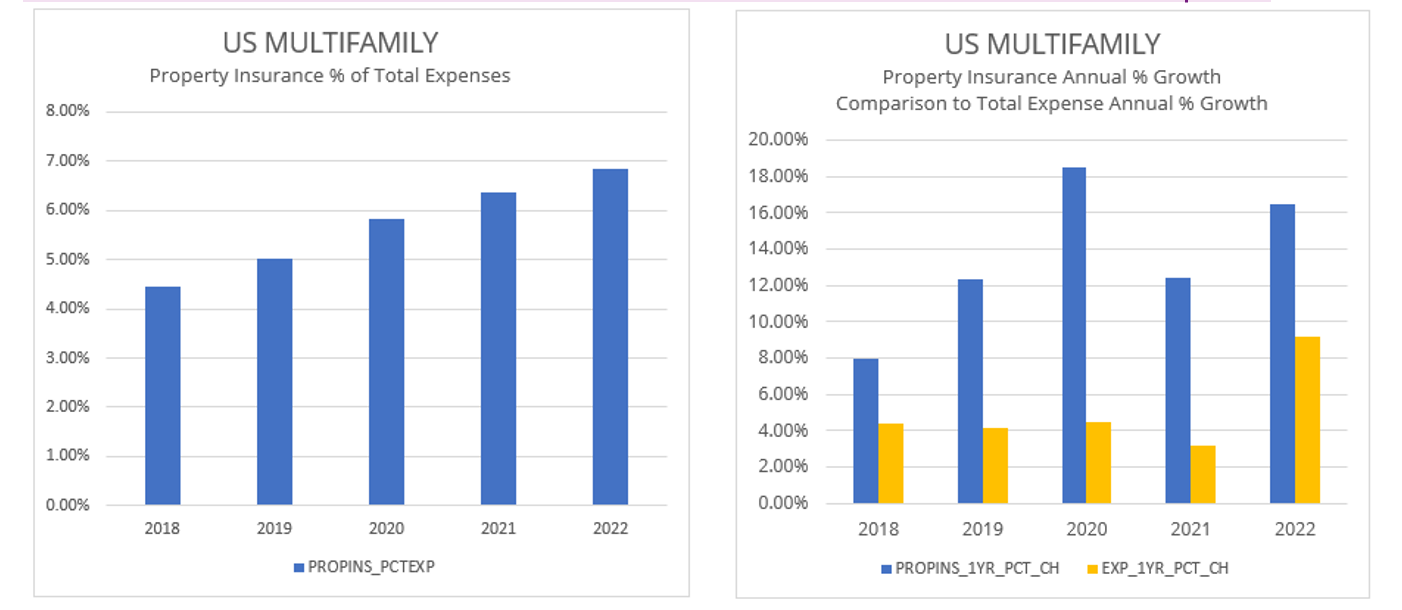
Source: Thirty Capital Performance Group
One can see that growth in the CRE Property Insurance line-item has grown significantly, as % of Total Expenses and Annual Growth has dwarfed Total Expense in each of the last five years. Insurance growth was 16.48% in 2022 in comparison to the 9.20% Total Expense Growth. Over the last five years, Property Insurance Annual Growth has averaged 13.55% in comparison to 5.09% for Total Expense Growth. The trend reflects the higher and growing number of high payouts on natural disasters, particularly as seen in Florida and Texas. We expect this trend to continue as insurance companies seek to control risk. Another important observation from these charts is the breakout year for Total Expense Growth in 2022, clocking in at 9.20% in comparison to the 5.09% 5yr Average.
Using the Chartbook Data to Navigate Rising CRE Property Insurance Costs
The 2023 State of Multifamily Operating Performance Chartbook provides data that can be used in modeling, proformas, budgets, etc. Underwriters and owners alike can use data from the chartbook as they review their assumptions, rethink their strategies, and create new models. The chartbook data comes in handy because the more specificity you have, the safer and less risky your assumptions will be. Additionally, you can get a more realistic look at what’s going to come out of a particular investment.